



 单品直降
单品直降
 满额赠礼
满额赠礼

| 货号-规格 | 货期 | 价格 | 数量 |
|---|---|---|---|
| abs920-25mL×2 | 现货 | ¥ 180 .00 | |
| abs920-50mL×2 | 现货 | ¥ 280 .00 | |
| abs920-250mL×2 | 现货 | ¥ 400 .00 |
订购信息:
您可以从我们的授权经销商处购买absin产品或获得技术支持。
实验结果图
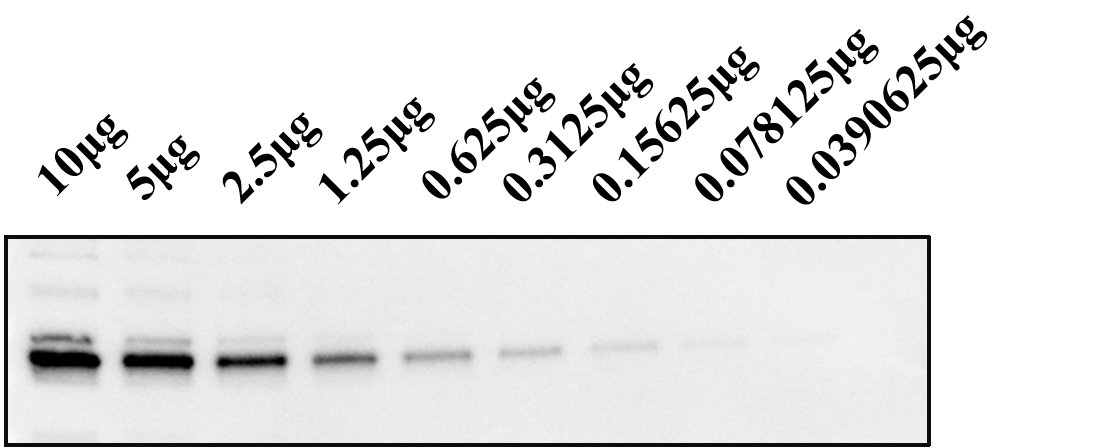
Western blot analysis of Akt expression in HEK-293T whole cell lysates
文献相关图

The PCR products of DXS cDNA gene from Pyropia haitanensis.M1, Takara DL2000 bp DNA marker; R1, 5′ RACE PCR: 857 bp; R2, 5′ RACE Nest PCR: 857 bp; YZ, checking fragment: 1,027 bp; C, DXS core fragment: 2,363 bp; M2, Takara DL5000 bp DNA marker. PCR,polymerase chain reaction; DXS, 1-deoxy-D-xylulose 5-phosphatesynthase.
来源于《Mol Med Rep》
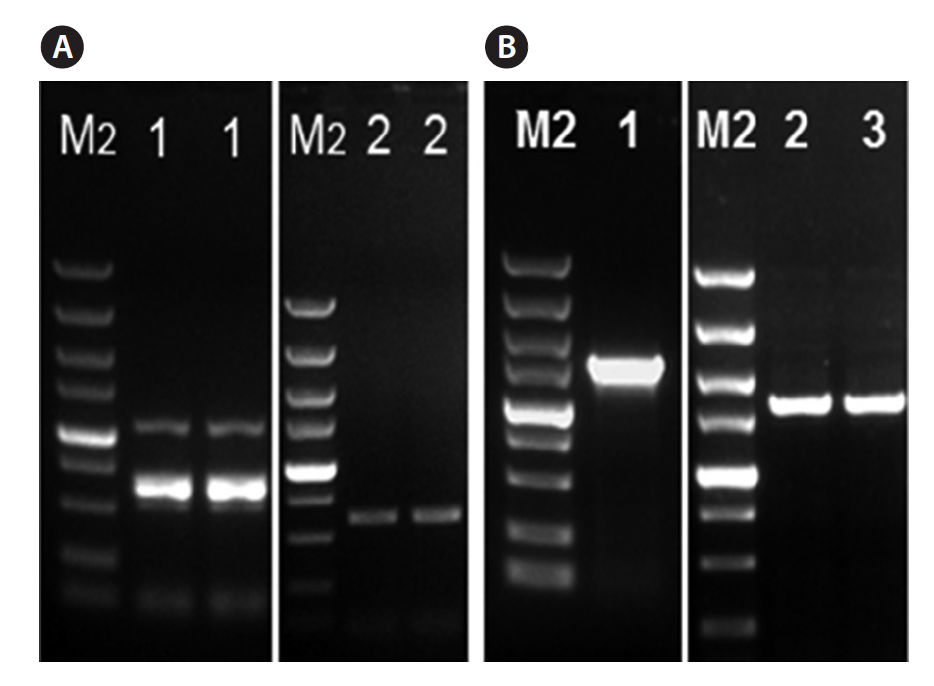
PCR products of GGPS and DXR genes. (A) The partial GGPSfrom Pyropia haitanensis. M2, Takara DL5000 bp DNA marker; 1, GGPSDNA gene: 612 bp; 2, GGPS cDNA gene: 612 bp. (B) DXR from Pyropiahaitanensis. M2, Takara DL5000 bp DNA marker; 1, DXR DNA gene:1,458 bp; 2 & 3, DXR cDNA gene: 1,474 bp. PCR, polymerase chainreaction; GGPS, gene geranylgeranyl diphosphate synthase; DXR,1-deoxy-D-xylulose 5-phosphate reductoisomerase.
来源于《Mol Med Rep》

The effect of IL-17Aadministrationonexpressionsofinflammatorysubstances andneuropeptidesofLSG. within the LSG in the IL-17A-treated groups (a portion of the LSG is shown at 400×). Representative bands and quantitative analysis of p-TrkA and c-fos expression (E)
来源于《Cell Death Dis》

TheeffectofIL-17AonIL-17R-AsignalingintheLSG.Representative images and quantitative analysis of the results of western blot analysis for ACT1, p65, and p-p65 (B).
来源于《Cell Death Dis》

Nrf2 translocation in Pb2+-induced HT22cells were promoted by Se-containing peptides. (A) Immunofluorescence of Nrf2 nuclear translocation. (B) The expressionofNrf2proteinincytoplasmandnucleiofcells.Differentlettersofthebanksofdifferentpeptidesrepresentsignificantdifferences(P<0.05).“—”means Pb2+ alone group.
来源于《Oncol Lett》
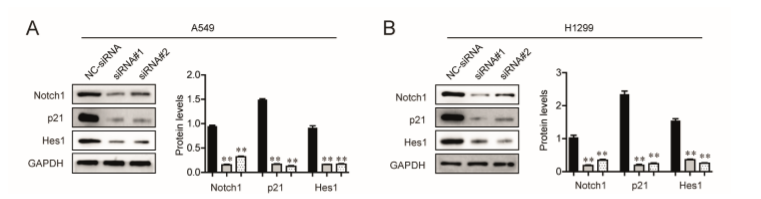
The activity of Notch signaling pathway in A549 and H1299 cells was depressed by silence of PKMYT1. A, Protein levels of Notch1, p21, and Hes1 in A549 cells were detected by Western blot analysis. The optical density of the proteins was analyzed by Image J (NIH, Bethesda, MD, USA). B, Western blot assays determined corresponding protein levels in H1299 cells. * p < 0.05, **p < 0.01.
来源于《Oncology Letters》

PKMYT1 silence inhibited the invasion and migration of A549 and H1299 cells. A and B, Migratory capacity of A549 and H1299 cells was decreased after they were transfected with PKMYT1 siRNAs (Magnification: 10×). C, After knock‑ down of PKMYT1 siRNAs, the invasion ability of A549 and H1299 cells was decreased (Magnification: 40×). D and E, Protein expression of A549 and H1299 cells was determined by Western blot analysis. * p < 0.05, **p < 0.01.
来源于《Oncology Letters》
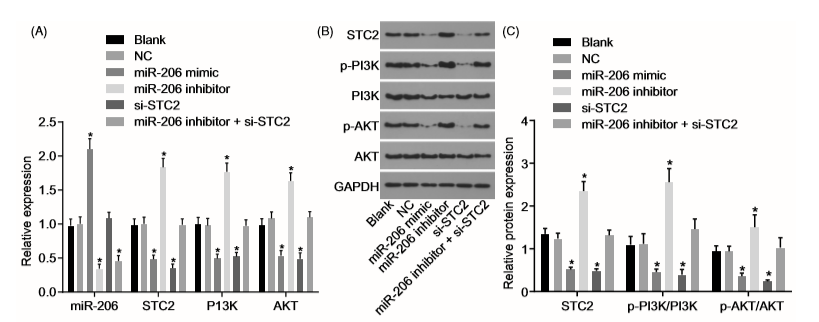
来源于《Eur Rev Med Pharmacol Sci》

来源于《Eur Rev Med Pharmacol Sci》
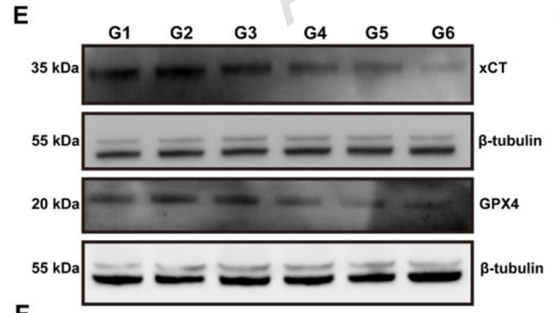
来源于《Journal of Nanobiotechnology》 DOI:10.1186/s12951-026-04882-5
温馨提示:本产品仅作科研实验使用
















 危险品化学品经营许可证(不带存储) 许可证编号:沪(浦)应急管危经许[2022]202585(YS)
  营业执照(三证合一)