



 单品直降
单品直降
 细胞培养挑战赛
 满额赠礼
满额赠礼

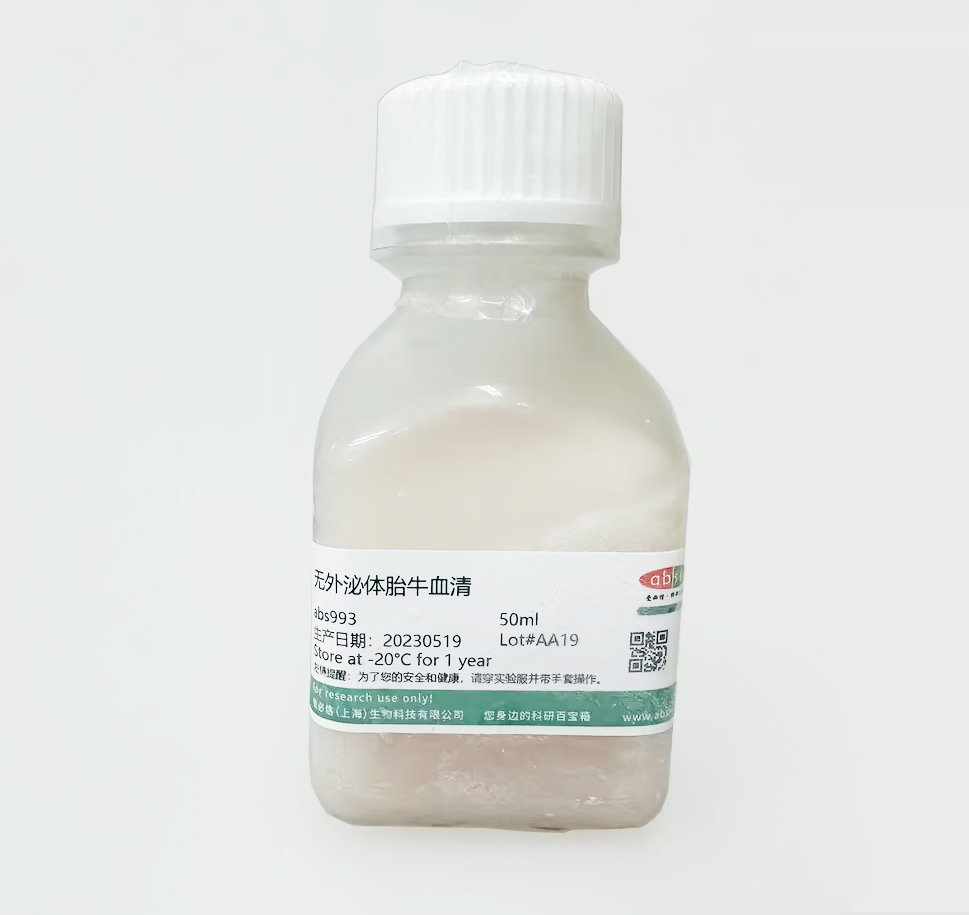
| 货号-规格 | 货期 | 价格 | 数量 |
|---|---|---|---|
| abs993-50mL | 现货 | ¥ 1363 .00 |
订购信息:
您可以从我们的授权经销商处购买absin产品或获得技术支持。
文献相关图
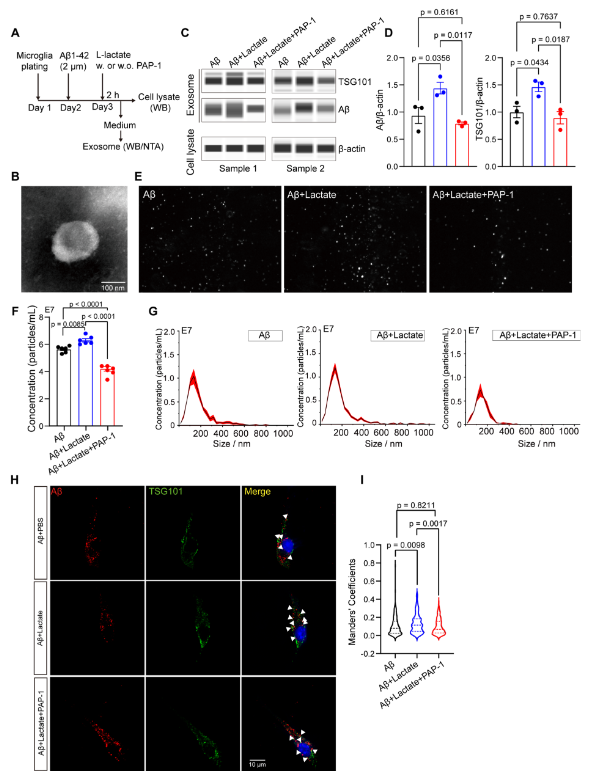
Kv1.3 inhibition by PAP-1 reduces Aβ-containing exosome release from microglia triggered by lactate. (A) Experimental timeline for microglia incubation and exosome collection. (B) Representative electron micrograph displays morphology and size of exosomes from primary microglia. (C) Two examples of western blotting image of TSG101 and Aβ in exosome, and β-actin in cell lysate. (D) Quantification of Aβ (Left) and exosomal marker TSG101 (Right) levels in exosomes isolated from primary microglia culture medium, normalized to β-actin in cell lysates (n = 3 per group). (E-G) Nanoparticle tracking analysis of exosome size distribution (E, G) and concentration (F) secreted by Aβ-treated microglia with or without lactate and PAP-1 incubation (n = 6 per group). (H, I) Representative immunostaining images showing TSG101, Aβ expression (H) and Manders’ Coefficients analysis of co-localization between Aβ and TSG101 in Aβ treated microglia with or without lactate and PAP-1 stimulation (I) (n > 360 cells from 3 independent experiments per group).White arrows indicate the colocalization of exosome and Aβ. One-way ANOVA with Tukey post hoc analysis for (D, F, I). Data are represented as mean ± SEM
来源于《Journal of Neuroinflammation》 DOI:10.1186/s12974-025-03488-2
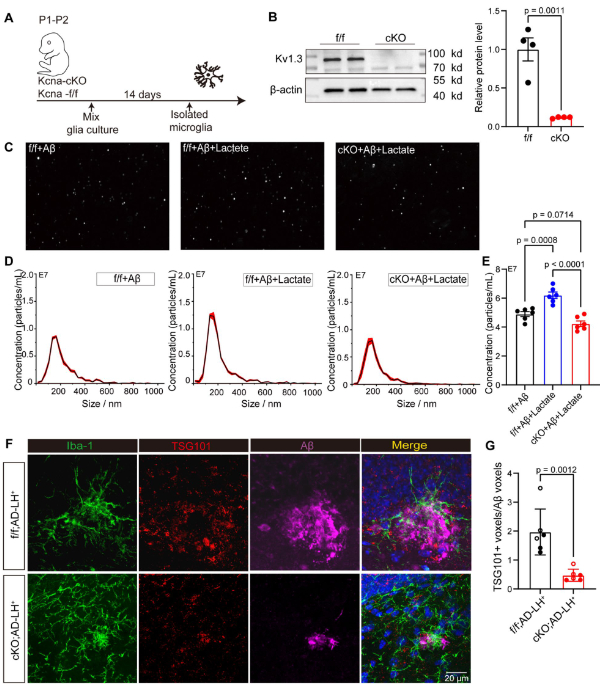
Kv1.3 knockout blocks exosome release from microglia triggered by lactate and depression. (A) Schematic representation for primary microglia cultures from Kcna3-cKO and Kcna3-f/f mice. (B) Western blot verify the knockout efficiency of Kv1.3 in microglia (n = 4 per group). (C-E) Nanoparticle tracking analysis of exosome size distribution (C-D) and concentration (E) secreted by Aβ-treated cKO or f/f microglia with or without lactate stimulation (n = 6 per group). (F-G) Representative immunostaining images showing Iba1, TSG101, and Aβ expression (F) and quantification of TSG101+ voxels relative to Aβ voxels in the f/f; AD-LH+ and cKO; AD-LH+ groups (G) (n = 6 per group). Male mice are represented as filled circles and female mice as open circles. Representative images shown are from male mice. One-way ANOVA with Tukey post hoc analysis for (E) or two-tailed unpaired t-test for (B, G). Data are represented as mean ± SEM
来源于《Journal of Neuroinflammation》 DOI:10.1186/s12974-025-03488-2
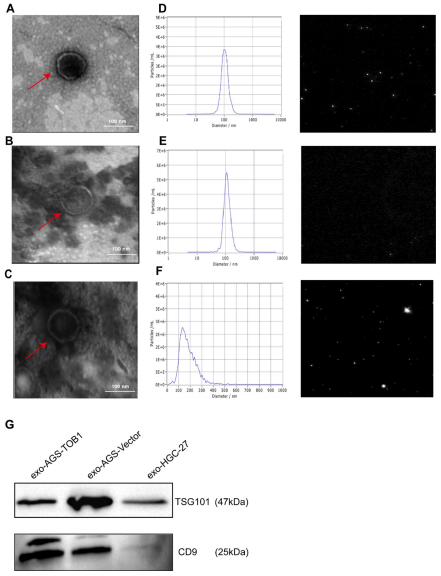
Identification of exosomes released by gastric cancer cells. (A–C) Morphological structures of exoAGS-TOB1, exo-AGS-Vector, and exo-HGC-27 (scale bar =100 nm). (D–F) Peak diameters and Brownian motion characteristics of purified exosomal particles from exo-AGS-TOB1, exo-AGS-Vector, and exoHGC-27. (G) Expression levels of the exosomal markers TSG101 and CD9 proteins as determined by western blot analysis.
来源于《Sci Rep》 DOI:10.1038/s41598-025-12789-8.
温馨提示:本产品仅作科研实验使用














 危险品化学品经营许可证(不带存储) 许可证编号:沪(浦)应急管危经许[2022]202585(YS)
  营业执照(三证合一)