



顶刊 JITC 重磅|Absin 助力破解前列腺癌免疫抑制,CXCR6⁺CD8⁺T 细胞调控新机制问世
作者:爱必信高级产品经理 时间:2026-04-22 点击次数:114


前列腺癌作为典型免疫 "冷" 肿瘤,免疫检查点抑制剂疗效有限。近期,复旦大学附属肿瘤医院团队在《Journal for ImmunoTherapy of Cancer》发表突破性成果,首次揭示IL 10–STAT3–FOXO1–KLF2–CXCR6双重调控轴决定肿瘤内 CD8⁺T 细胞功能命运,为前列腺癌免疫治疗提供全新靶点。研究中Absin 二抗(abs996) 为关键免疫组化实验提供稳定高效检测,助力高分文章顺利产出!
文献标题:Dual regulation of CXCR6+CD8+ T cells modulates cytotoxic and exhaustion-associated programs during prostate cancer progression
发表期刊:J Immunother Cancer. (IF=10.6)
DOI:https://doi.org/10.1136/jitc-2025-014276
使用 Absin 产品:即用型免疫组化二抗试剂盒(鼠兔通用型)(货号:abs996)

一、研究核心背景:冷肿瘤的免疫困境
• 前列腺癌免疫抑制微环境显著,效应 T 细胞浸润少、功能耗竭,免疫治疗响应率低。
• CXCR6 是细胞毒性 CD8⁺T 细胞关键标志物,但在前列腺癌中的调控机制与临床价值尚不明确。
• 本研究旨在解析CXCR6⁺CD8⁺T 细胞在肿瘤进展中的作用、招募机制及转录调控网络。
二、完整研究思路:从单细胞发现→机制验证→治疗转化
1. 发现:CXCR6⁺CD8⁺T 细胞是高效抗肿瘤亚群,随肿瘤进展丢失
• 对 9 例患者90,651 个单细胞测序,鉴定出 5 个 CD8⁺T 亚群,效应样亚群高表达 CXCR6、GZMA、PRF1,细胞毒性最强(原文 Fig.1A–E)。
• 多重免疫荧光与流式证实:CXCR6⁺CD8⁺T 细胞密度与 Gleason 评分负相关,高级别肿瘤中显著减少(原文 Fig.1F–I)。
• 体外验证:CXCR6⁺CD8⁺T 细胞GZMB、IFN γ 分泌显著更高,杀伤能力更强(原文 Fig.2)。
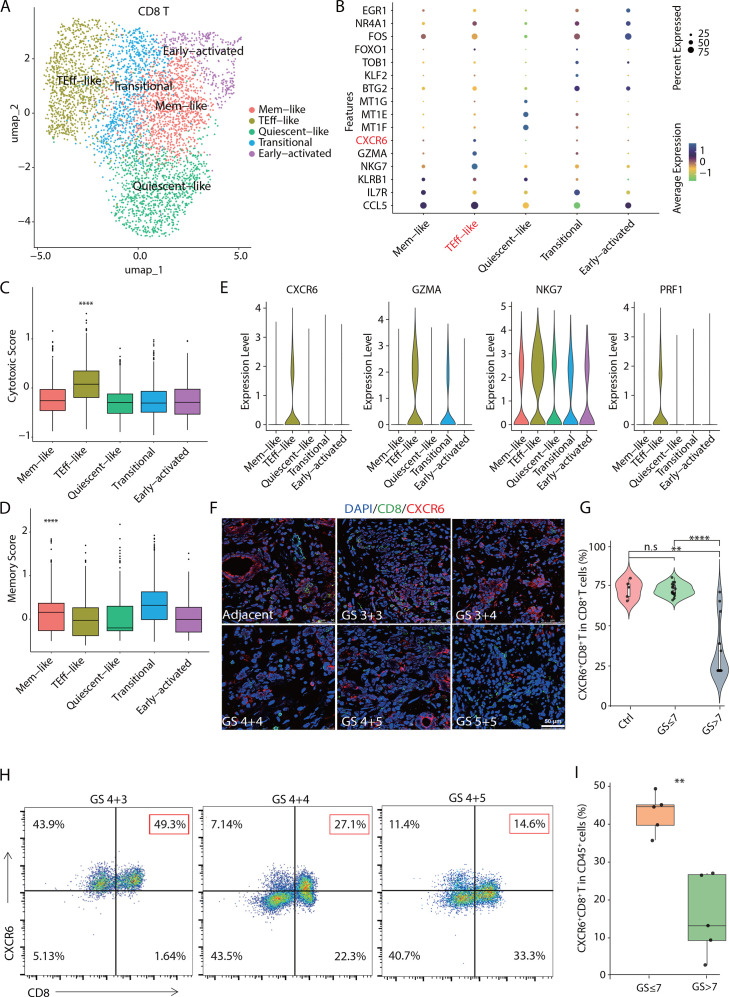
Figure 1.
CXCR6+CD8+ T cells represent a transcriptionally distinct effector-like subpopulation that is diminished in advanced prostate cancer. (A) UMAP visualization of tumor-infiltrating CD8+ T cells (n=9 patients) clustered into five transcriptionally distinct subsets: memory-like (Mem-like), effector-like (TEff-like), quiescent-like, transitional, and early-activated. (B) Dot plot showing the expression of representative transcription factors, stress-response genes, and effector molecules across CD8+ T cell subsets. Dot size indicates the percentage of cells expressing each gene, and color denotes the scaled average expression. (C) Cytotoxicity score of each CD8+ T cell subtype based on a curated gene set of cytolytic effector genes. Kruskal–Wallis test, ****p<0.0001. (D) Memory score of each CD8+ T cell subtype derived from published memory-associated gene signatures. Kruskal-Wallis test, ****p<0.0001. (E) Violin plots of CXCR6, GZMA, NKG7, and PRF1 expression across CD8+ T cell subsets. CXCR6 is predominantly expressed in TEff-like cells. (F) Representative multiplex immunofluorescence (mIF) images of prostate tumor sections stained for DAPI (blue), CD8 (green), and CXCR6 (red), across adjacent tissues (n=5), and tumors stratified by GS: intermediate/low-risk (GS ≤7, n=16) and high-risk (GS >7, n=13) PCa tissues. Scale bars, 50 µm. (G) Quantitative analysis of mIF data showing the infiltration density of CXCR6+CD8+ T cells across clinical groups: adjacent/control (Ctrl), GS ≤7, and GS >7 tumors. Kruskal-Wallis test, **p<0.01, ****p<0.0001. (H) Flow cytometry analysis of CXCR6+CD8+ T cell frequency among total CD45+ immune cells in intermediate/low-risk (GS ≤7, n=5) and high-risk (GS >7, n=5) PCa tissues. (I) Quantification of flow cytometry analysis from (H). Data are shown as mean±SEM. Mann-Whitney U test, **p<0.01. DAPI, 4′,6-diamidino-2-phenylindole; GS, Gleason Score; PCa, prostate cancer.
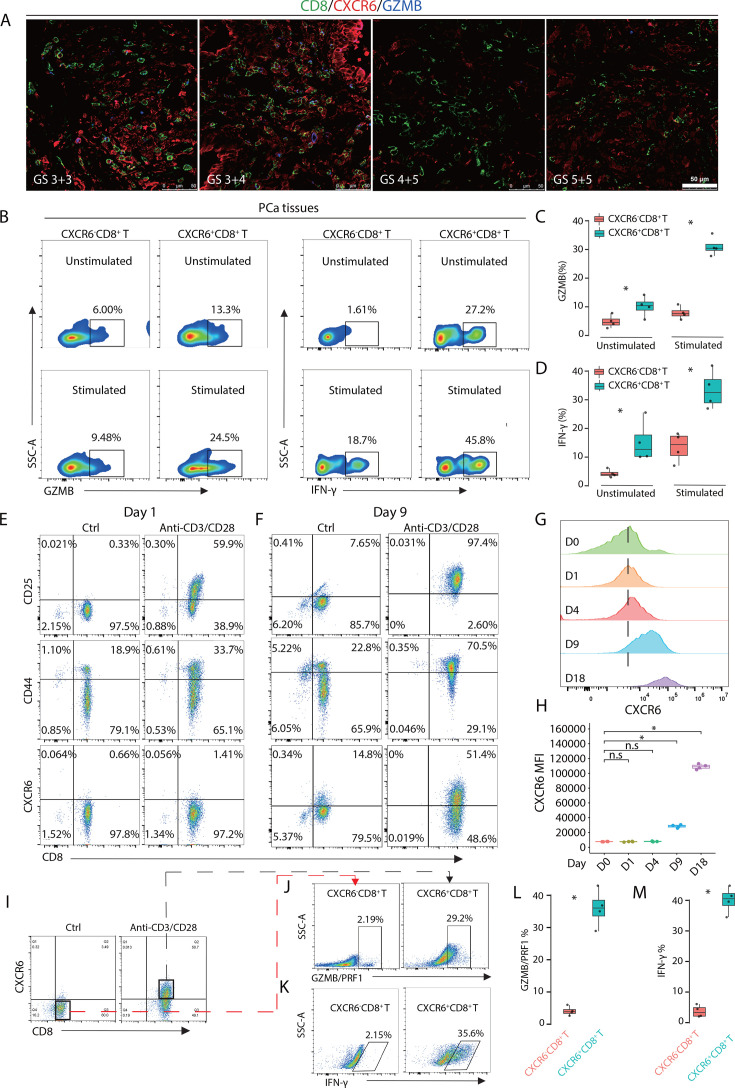 Figure 2.
CXCR6+CD8+ T cells possess a stronger cytotoxic activity than the CXCR6– counterparts. (A) Representative mIF images of human PCa tissues stained for CD8 (green), CXCR6 (red), and GZMB (blue), across tumors with increasing GS. CXCR6+CD8+ T cells co-expressing GZMB were more frequent in low-grade tumors (GS=3+3) and markedly reduced in high-grade tumors (GS=5+5). Scale bars: 50 µm. (B) Representative flow cytometry plots showing the expression of GZMB and IFN-γ in CXCR6⁻ and CXCR6+ CD8+ T cells isolated from PCa tissues after a 4-hour treatment with cell stimulation cocktail (plus protein transport inhibitors). (C, D) Quantification of the frequencies of GZMB+ (C) and IFN-γ+ (D) cells among CXCR6⁻ vs CXCR6+CD8+ T cells under unstimulated and stimulated conditions. Mann-Whitney U test, *p<0.05. (E, F) Murine splenic CD8+ T cells were activated with anti-CD3 (5 µg/mL) and anti-CD28 (5 µg/mL) in the presence of IL-2 (10 ng/mL) for 48 hours, followed by medium replacement and continued culture in IL-2 (10 ng/mL). Representative flow cytometry plots of murine splenic CD8+ T cells on day 1 (E) and day 9 (F) following the above stimulation, showing the expression of CD25, CD44, and CXCR6. (G) Histograms depicting the time-course expression of CXCR6 on CD8+ T cells over 18 days of serial stimulation. (H) Mean fluorescence intensity (MFI) of CXCR6 expression at the indicated time points. n=5 mice per group. One-way ANOVA with multiple comparisons, *p<0.05. (I) Gating strategy for CXCR6⁻ and CXCR6+CD8+ T cell populations derived from in vitro stimulated murine splenocytes. (J, K) Representative plots of GZMB/PRF1 (J) and IFN-γ (K) production in sorted CXCR6+ versus CXCR6⁻CD8+ T cells. (L, M) Quantification of the frequencies of GZMB/PRF1+ (L) and IFN-γ+ (M) cells in CXCR6+ vs CXCR6⁻CD8+ T cells. Mann-Whitney U test, *p<0.05. ANOVA, analysis of variance; GS, Gleason Score; mIF, multiplex immunofluorescence; PCa, prostate cancer.
2. 招募:M1 样巨噬细胞分泌 CXCL16,招募 CXCR6⁺CD8⁺T 细胞
• 单细胞分析显示IL1B⁺M1 样巨噬细胞高分泌 CXCL16(CXCR6 唯一配体)(原文 Fig.4A–F)。
• 肿瘤进展中 M1 向 M2 极化,CXCL16 减少,导致CXCR6⁺CD8⁺T 细胞招募不足(原文 Fig.4N–P)。
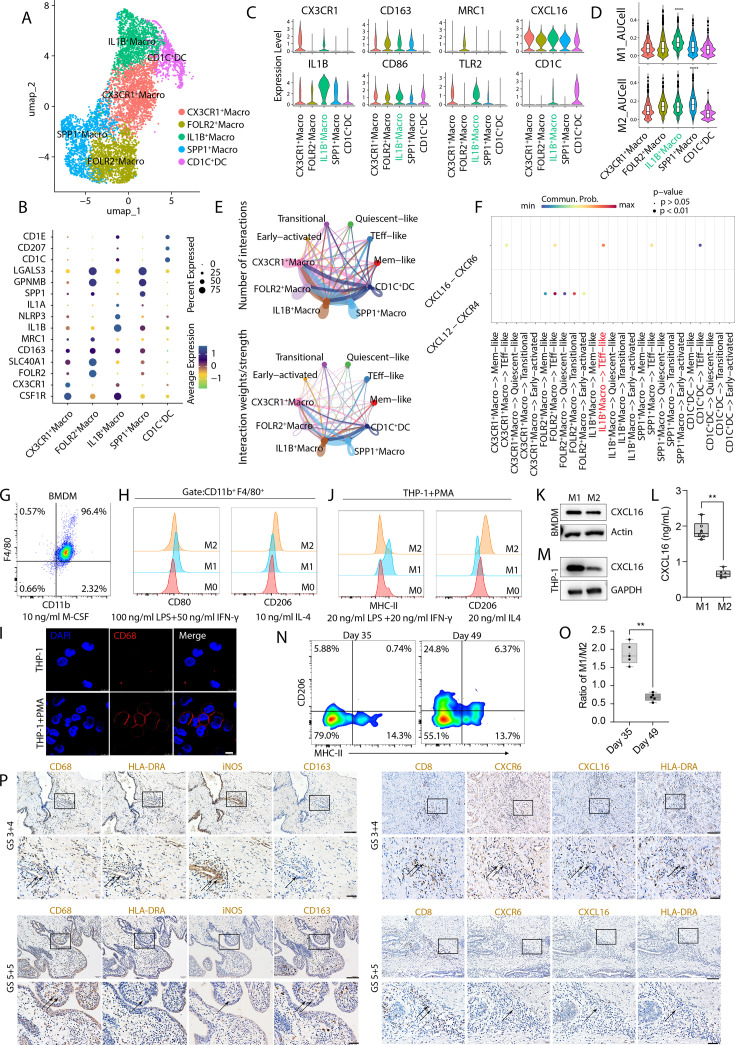 Figure 4.
M1-like macrophages secrete CXCL16 and support CXCR6+CD8+ T-cell recruitment but are progressively lost during PCa progression. (A) UMAP plot of tumor-infiltrating myeloid cells from PCa tissues, identifying five distinct clusters, including an IL1B+ macrophage subset. (B) Dot plot showing average expression and detection frequency of selected marker genes across macrophage and dendritic cell (DC) clusters. (C) Violin plots illustrating the expression of key pro-inflammatory (IL1B, TLR2, CD86), anti-inflammatory (CD163, MRC1), and chemokine (CXCL16) genes across myeloid subsets. (D) AUCell-based quantification of M1 and M2 gene signatures across clusters; IL1B+ macrophages exhibit the highest M1 signature score. Kruskal-Wallis test, ****p<0.0001. (E) CellChat network visualizing outgoing macrophage-derived signals to CD8+ T-cell subsets; IL1B+ macrophages prominently interact with CXCR6+ TEff-like CD8+ T cells. (F) Bubble plot visualizing the results of ligand–receptor interaction analysis; CXCL16–CXCR6 axis ranks among the strongest predicted signals. (G) Gating strategy for the identification of murine bone marrow-derived macrophages (BMDMs) induced with M-CSF. (H) Flow cytometry of BMDMs polarized to M1 (IFN-γ+LPS) or M2 (IL-4) states, assessed by CD80 and CD206 expression. (I) Confocal images of THP-1-derived macrophages stained for CD68 after PMA induction. (J) Flow cytometry of THP-1-derived macrophages polarized to M1 (IFN-γ+LPS) or M2 (IL-4) states, assessed by MHC-II and CD206 expression. (K) Immunoblots showing higher CXCL16 levels in M1-polarized BMDMs compared with their M2 counterparts. (L) ELISA quantification of secreted CXCL16 in the supernatants of M1-polarized and M2-polarized THP-1-derived macrophages. Mann-Whitney U test, **p<0.01. (M) Immunoblot analysis demonstrating elevated levels of CXCL16 in M1-polarized THP-1-derived macrophages compared with M2-polarized cells. (N, O). A total of 5×10⁶ TRAMP-C1 cells suspended in 100 µL PBS were subcutaneously implanted into the right flank of 5–6-week-old male WT C57BL/6J mice (n=5 per group). Tumors were harvested at day 35 (early stage) and day 49 (advanced stage) post-inoculation. Flow cytometric analysis of TAMs revealed a significant reduction in the ratio of MHCII+CD206⁻ (M1-like) to MHCII⁻ CD206+ (M2-like) macrophages during tumor progression. Mann-Whitney U test, **p<0.01. (P) Multiplex immunohistochemistry of human PCa tissues (GS=3+4 vs GS=5+5) demonstrated spatial proximity between CXCL16+ M1-like macrophages (HLA-DRA+) and CXCR6+CD8+ T cells in lower-grade (GS=3+4) tumors, which was largely diminished in high-grade (GS=5+5) lesions. Black arrows indicate matched regions across serial tissue sections. Scale bars: upper panels, 100 µm; lower panels, 40 µm. AUCell, area under the recovery curve; GS, Gleason Score; M-CSF, macrophage colony-stimulating factor; PCa, prostate cancer; PBS, phosphate-buffered saline; TAMs, tumor-associated macrophages.
3. 耗竭:IL 10–STAT3–FOXO1–KLF2 轴抑制 CXCR6,导致 T 细胞功能低下
• 肿瘤微环境IL 10 主要来自 CD163⁺M2 样巨噬细胞(原文 Fig.7M)。
• IL 10 激活 STAT3→上调FOXO1→转录激活KLF2→直接抑制CXCR6启动子(原文 Fig.5–7)。
• 形成外源招募不足 + 内源功能抑制的双重免疫抑制机制。
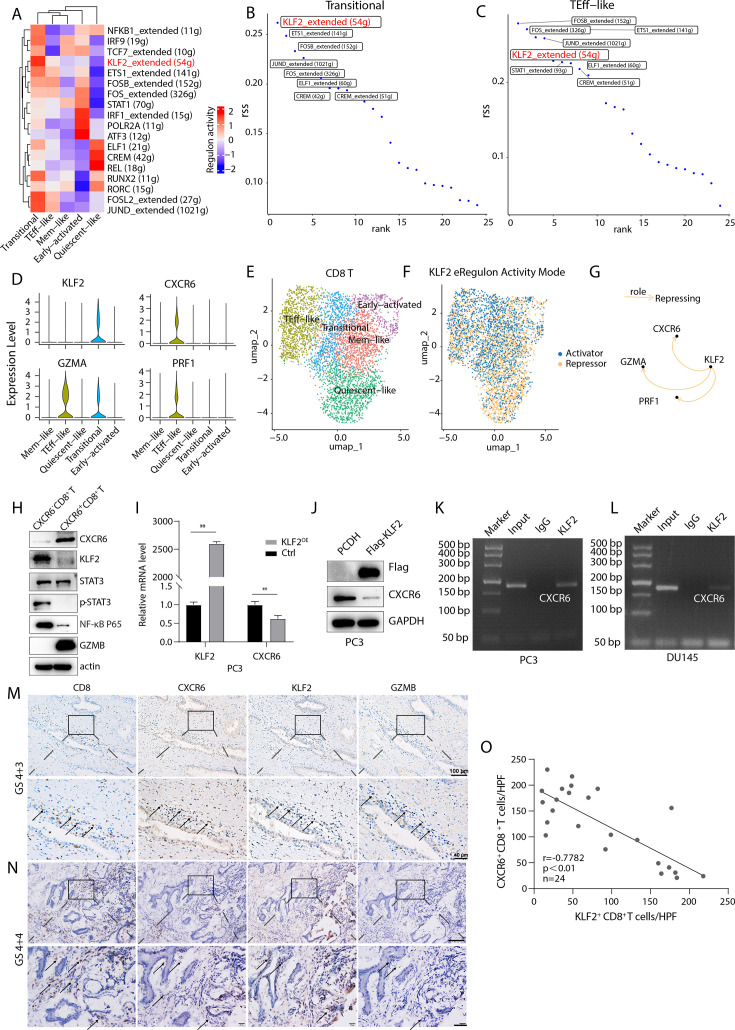 Figure 5.
KLF2 represses the cytotoxic CXCR6 program in intratumoral CD8+ T cells. (A) Heatmap displaying the top transcriptional regulons across CD8+ T-cell subclusters, as identified by SCENIC analysis. Color scale indicates normalized regulon activity. (B, C). Regulon specificity score (RSS) analysis identified KLF2 as a top-ranking regulon in both Transitional (B) and TEff-like (C) CD8+ T-cell subsets. (D) Violin plots showing expression of KLF2, CXCR6, GZMA, and PRF1 across five CD8+ T-cell subsets. TEff-like cells exhibit high expression of CXCR6 and effector genes but low KLF2 levels. (E) UMAP visualization of CD8+ T-cell subclusters. (F) KLF2 regulon activity mode projected on the UMAP; color distinguishes activator (blue) and repressor (orange) regulon status. (G) SCENIC-derived gene regulatory network diagram showing KLF2 as a predicted repressor of CXCR6, GZMA, and PRF1. (H) Western blot analysis of sorted CXCR6⁻ and CXCR6+CD8+ T cells. CXCR6+CD8+ T cells showed higher GZMB expression and lower levels of p-STAT3, NF-κB p65, and KLF2 compared with CXCR6⁻ cells, indicating a cytotoxic but transcriptionally distinct phenotype. Actin served as a loading control. (I, J) qPCR (I) and Western blot analysis (J) were performed to evaluate the expression levels of KLF2 and CXCR6 in PC3 cells following transfection with the Flag-KLF2 plasmid for 48 hours. Mann-Whitney U test, **P<0.01. (K, L) ChIP-qPCR demonstrating KLF2 binding to the CXCR6 promoter in PC3 (K) and DU145 (L) cells; IgG served as a negative control. (M, N) Immunohistochemistry on serial sections of human PCa specimens (GS=4+3 vs GS=4+4) stained for CD8, CXCR6, KLF2, and GZMB. CXCR6+GZMB+CD8+ T cells are enriched in low-grade (GS=4+3) tumors, whereas KLF2+CD8+ T cells predominate in high-grade (GS=4+4) lesions. Scale bars: upper panel, 100 µm; lower panel, 40 µm. (O) Spearman correlation analysis between CXCR6+ and KLF2+CD8+ T cell densities in PCa tissues (n=24). A significant inverse correlation was observed between CXCR6+ and KLF2+CD8+ T cells per high-power field (HPF) (r = –0.7782, P<0.01). ChIP-qPCR, chromatin immunoprecipitation-quantitative real-time PCR; GS, Gleason Score.
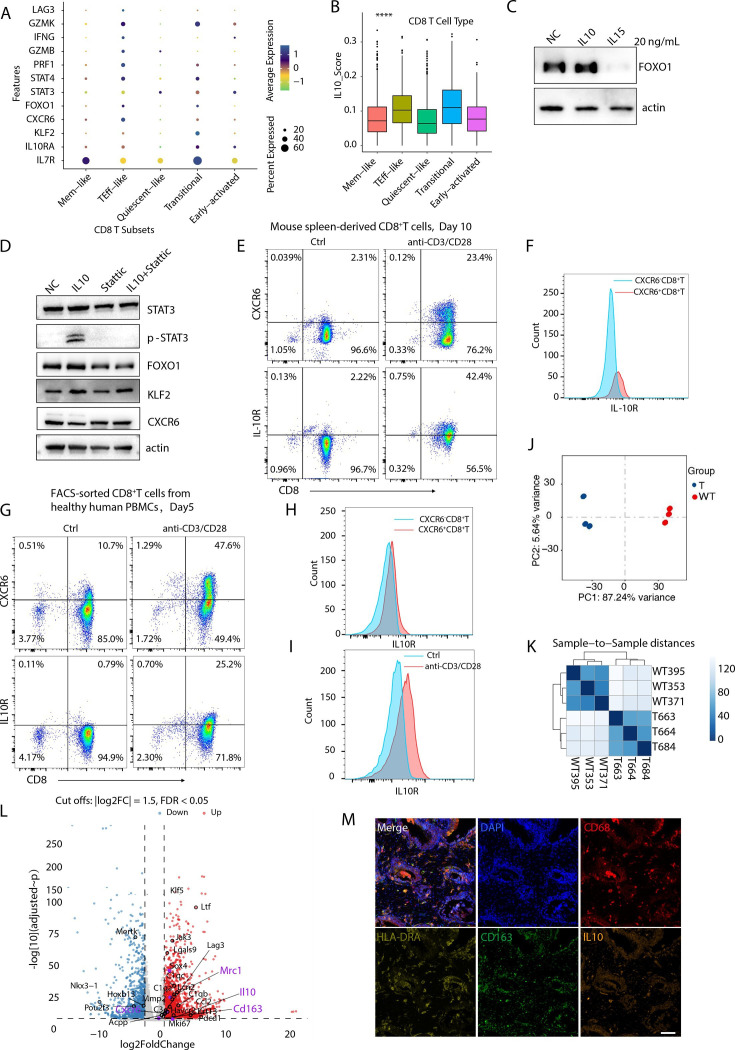 Figure 7.
IL-10–STAT3–FOXO1 signaling reprograms CXCR6+CD8+ T cells toward a dysfunctional state. (A) Dot plot showing the expression of IL10RA, STAT3, STAT4, CXCR6, and related markers across CD8+ T cell subsets in scRNA-seq data. (B) IL-10 pathway activity scores across CD8+ T cell clusters. Kruskal-Wallis test, ****p<0.0001. (C, D) Murine splenic CD8+ T cells cultured in a medium containing anti-CD3 (5 µg/mL), anti-CD28 (5 µg/mL), and IL-2 (10 ng/mL) for 48 hours. Following initial activation, cells were maintained in fresh medium supplemented with IL-2 (10 ng/mL) for an additional 7 days. On day 9, cells were treated with 20 ng/mL murine IL-10, IL-15, or STAT3 inhibitor Stattic (2 µM) for 24 hours. The protein expression of STAT3, p-STATS, FOXO1, KLF2, and CXCR6 was assessed by Western blot analysis. (E, F) Flow cytometry of mouse spleen-derived CD8+ T cells shows preferential expression of IL-10R on CXCR6+CD8+ T cells, with upregulation observed following TCR stimulation (anti-CD3/CD28+IL-2, day 10), indicating heightened susceptibility to IL-10-mediated signaling. (G–I) Flow cytometry of human peripheral blood mononuclear cell (PBMC) CD8+ T cells from healthy donors similarly demonstrates enhanced IL-10R expression on CXCR6+CD8+ T cells and its induction on TCR stimulation. (J) PCA of bulk RNA-seq. Prostate tissues from Pb-Cre; Ptenflox/flox (T) and WT mice (n=3/group) were profiled by bulk RNA-seq. PCA separated T (blue) from WT (red) chiefly along PC1 (87.24% variance) and PC2 (5.64%). (K) Sample-to-sample distance heatmap. Distance matrix based on transformed expression values shows tight clustering of biological replicates within genotype and clear segregation between T and WT. (L) Volcano plot. Differential expression analysis between T and WT (cut-offs |log2FC|≥1.5, FDR<0.05). Points are colored by direction (Up=red; Down=blue). Dashed lines indicate thresholds. Il10, Mrc1, Cd163, and Cxcr6 are highlighted in purple; other selected genes are labeled as indicated. Y-axis shows –log10 (adjusted p). (M) Multiplex immunofluorescence (human prostate). Representative fields from human prostate specimens (n=9). Channels: DAPI (nuclei), CD68 (pan-macrophage), HLA-DRA (M1-like macrophage), CD163 (M2-like macrophage), and IL-10. IL-10 signal is enriched in tumor regions and co-localizes with CD68+CD163+ macrophages. Scale bar: 20 µm. DAPI, 4′,6-diamidino-2-phenylindole; FDR, false discovery rate; PCA, principal component analysis; scRNA-seq, single-cell RNA sequencing; WT, wild-type.
4. 干预:FOXO1 抑制剂 + 抗 PD 1 协同增效,逆转冷肿瘤
• FOXO1 抑制剂 AS1842856 可上调 CXCR6、增加肿瘤浸润、恢复细胞毒性(原文 Fig.6)。
• 联合抗 PD 1 显著抑制肿瘤生长,将冷肿瘤转为热肿瘤,提供全新联合治疗策略。
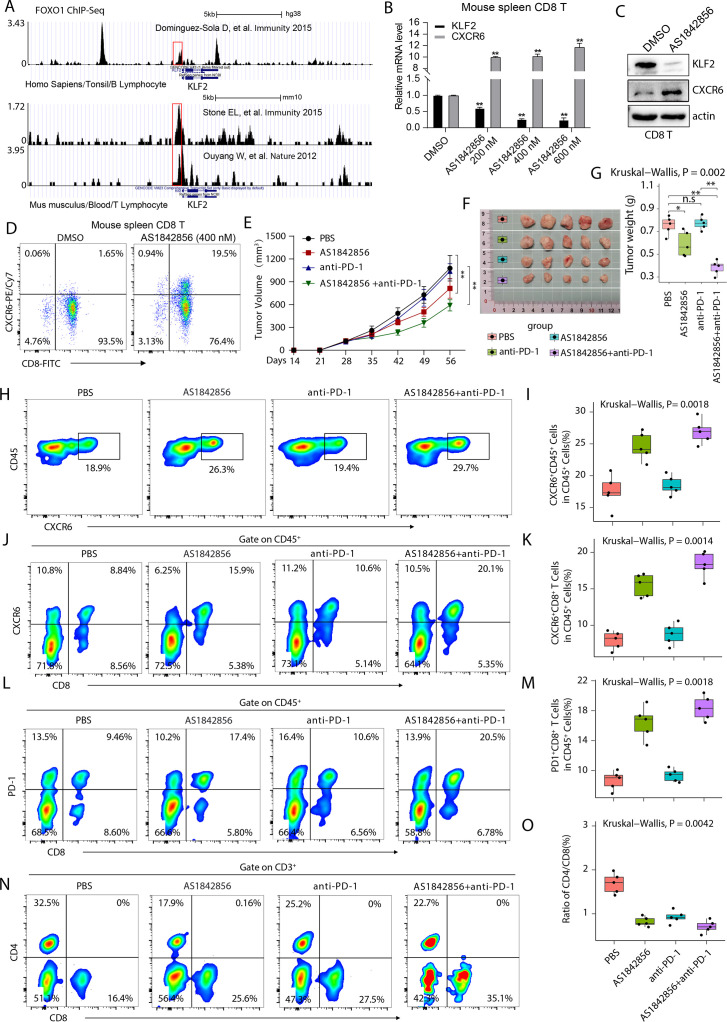 Figure 6.
FOXO1 regulates the KLF2–CXCR6 axis and modulates the intratumoral CD8+ T cell response to anti-PD-1 therapy. (A) FOXO1 ChIP-seq tracks from human and mouse lymphocytes show conserved binding at the KLF2 promoter region, supporting direct transcriptional regulation. (B) Murine splenic CD8+ T cells were treated with increasing concentrations of AS1842856 (0–600 nm, FOXO1 inhibitor) for 24 hours. The mRNA levels of KLF2 and CXCR6 were subsequently quantified by qPCR. Mann-Whitney U test, **P<0.01. (C, D) Murine splenic CD8+ T cells were exposed to 400 nm AS1842856 for 48 hours. Total protein levels of CXCR6 were assessed by Western blot analysis (C), while the surface expression of CXCR6 protein was evaluated by flow cytometry (D). (E–G) In the subcutaneous TRAMP-C1 tumor model, AS1842856 synergized with anti-PD-1 antibody to suppress tumor growth. TRAMP-C1 cells (5×10⁶ in 100 µL PBS) were subcutaneously implanted into the right flank of 5–6-week-old male WT C57BL/6J mice. On tumor palpation, mice were randomized into four groups (n=5/group) and treated intraperitoneally three times per week with: PBS (vehicle control), anti-PD-1 antibody (200 µg), AS1842856 (20 mg/kg), or a combination of both agents. Tumor volumes were measured weekly. Mann-Whitney U test *P<0.05; **P<0.01. (H, I) Flow cytometry showing increased frequency of CXCR6+CD45+ immune cells in tumors after AS1842856 or combination treatment. (J, K) Representative plots and quantification of CXCR6+CD8+ T cells within tumor-infiltrating CD45+ cells. (L, M) Frequency of PD-1+CD8+ T cells in tumors, showing further enrichment in the combination treatment group. (N, O) CD4+/CD8+ T cell ratio within tumor-infiltrating CD3+ lymphocytes, showing a significant reduction in the AS1842856+anti-PD-1 group, indicative of a CD8-dominant immune shift. Statistical comparisons were performed using the Kruskal-Wallis test with post hoc correction. ChIP, chromatin immunoprecipitation; PBS, phosphate-buffered saline; qPCR, quantitative real-time PCR.
三、Absin abs996 在研究中的关键作用
本研究免疫组化(IHC)检测全程使用Absin HRP 标记二抗(货号:abs996),承担一抗信号放大与显色核心任务:
1. 应用场景
用于 CD8、CXCR6、CXCL16、CD68、iNOS、HLA DRA、CD163、KLF2、FOXO1 等十余种指标的 IHC 检测。
2. 核心价值
o 高灵敏度:低丰度肿瘤浸润 T 细胞、巨噬细胞标志物清晰检出,信号强无衰减;
o 低背景:非特异性结合极低,组织定位精准,便于定量统计;
o 高兼容性:适配兔源、鼠源一抗,DAB 显色稳定,结果重复性好;
o 高效便捷:孵育时间短,大幅提升实验通量与数据可靠性。
3. 数据支撑
文章中多重免疫组化、组织定位、细胞定量结论均基于 abs996 的稳定检测,为机制验证提供关键图像证据。
四、核心研究成果总结
1. 新亚群:CXCR6⁺CD8⁺T 细胞是前列腺癌核心抗肿瘤效应亚群,与预后正相关;
2. 新机制:M1 巨噬细胞驱动招募,IL 10–STAT3–FOXO1–KLF2 轴驱动耗竭;
3. 新靶点:FOXO1、IL 10、CXCR6 可作为免疫治疗靶点;
4. 新策略:FOXO1 抑制剂联合抗 PD 1 可显著增强前列腺癌免疫治疗效果。
五、Absin 助力肿瘤免疫研究,高品质试剂赋能高分文章
Absin(爱必信)提供肿瘤免疫研究全链条试剂,本次助力顶刊的abs996更是广泛应用于 IHC、IF、WB 等实验:
• 二抗系列:HRP / 荧光标记二抗,高特异性、低背景;
• 免疫检测:一抗、ELISA 试剂盒、DAB 显色试剂盒;
• 热门靶点:CXCR6、CXCL16、FOXO1、KLF2、IL 10、CD8、GZMB 等抗体。
Absin 持续以高品质试剂支持科研创新,期待与更多研究者共同攻克肿瘤免疫难题!

Absin产品线:
爆款产品:十大试剂盒(mIHC、IHC、凋亡、ELISA、ChIP、Co-IP、生化检测、残留检测、多因子检测);细胞培养(类器官试剂盒+基质胶,胎牛血清+培养添加剂+细胞因子)、分化试剂盒;分子(mRNA合成服务+提取试剂盒);化合物大包装;辅助试剂、耗材/仪器、定制服务(抗体/多肽/蛋白/标记/检测)...
特色产品:鸡胚提取物CEE、B27、N2、霍乱毒素B亚单位CTB、牛脑垂体提取物BPE、百日咳毒素PTX、重组人胰岛素Insulin、人源低密度脂蛋白LDL...
|
爱必信(上海)生物科技有限公司 联系邮箱:info@absin.cn 微信公众号:爱必信生物 |
.jpg) |














 危险品化学品经营许可证(不带存储) 许可证编号:沪(浦)应急管危经许[2022]202585(YS)
  营业执照(三证合一)