



突破 CRC 免疫逃逸机制!Nat Cell Biol. 助力揭示肿瘤相关脂肪组织的 "免疫截留" 密码
时间:2026-04-07 点击次数:44


在结直肠癌(CRC)的免疫治疗领域,肿瘤微环境(TME)的复杂调控网络一直是研究焦点。近期发表于《Nature Cell Biology》的一项重磅研究,首次揭示了肿瘤相关内脏脂肪组织(tVAT)通过脂肪 - 间充质转化驱动免疫逃逸的全新机制。值得关注的是,爱必信(Absin)的 10% 正常山羊血清(产品货号:abs933)在这项研究的关键实验中发挥核心支撑作用,凭借多重硬核产品优势,为精准验证核心机制筑牢实验根基。
文献标题:Peritumoural adipose tissue drives immune evasion in colorectal cancer via adipose–mesenchymal transformation
发表期刊:Nat Cell Biol. (IF=19.1)
DOI:https://doi.org/ 10.1038/s41556-026-01885-0
使用 Absin 产品:山羊血清(货号:abs933)

一、研究思路:聚焦 tVAT,破解 CRC 免疫逃逸 "盲区"
以往研究多聚焦于肿瘤内部微环境,而 CRC 等内脏肿瘤周围丰富的脂肪组织常被忽视。该研究团队创新性提出假设:tVAT 作为肿瘤微环境的重要组成部分,可能通过与肿瘤争夺免疫细胞影响抗肿瘤免疫应答。
研究设计采用「全景解析 - 机制验证 - 临床转化」三步走策略:
- 通过单细胞 RNA 测序(scRNA-seq)和单核 RNA 测序(snRNA-seq),绘制 tVAT、远端内脏脂肪组织(dVAT)及肿瘤组织的免疫细胞和基质细胞图谱;
- 借助小鼠肿瘤模型,验证 tVAT 与肿瘤争夺免疫细胞的核心机制及关键信号通路;
- 结合临床患者数据,探索 tVAT 相关指标的诊断价值及靶向干预策略。
在整个实验流程中,免疫染色是验证细胞定位、分子表达的核心技术,实验试剂的稳定性直接决定数据可信度。爱必信abs933 10% 正常山羊血清,成为该研究免疫荧光(IF)、多重免疫组化(mIHC)实验的标配封闭试剂。
二、核心研究成果:tVAT 的 "免疫截留" 机制震撼揭晓
1. tVAT 是免疫细胞富集的 "隐藏阵地"
scRNA-seq 分析显示,tVAT 中淋巴细胞浸润显著富集,尤其是肿瘤特异性 CD8⁺ T 细胞,且存在多阶段成熟的三级淋巴结构(TLSs)(原文 Fig. 1g、Extended Data Fig. 1e)。证实 tVAT 并非单纯储能组织,而是具备强免疫活性的特殊微环境。
Fig. 1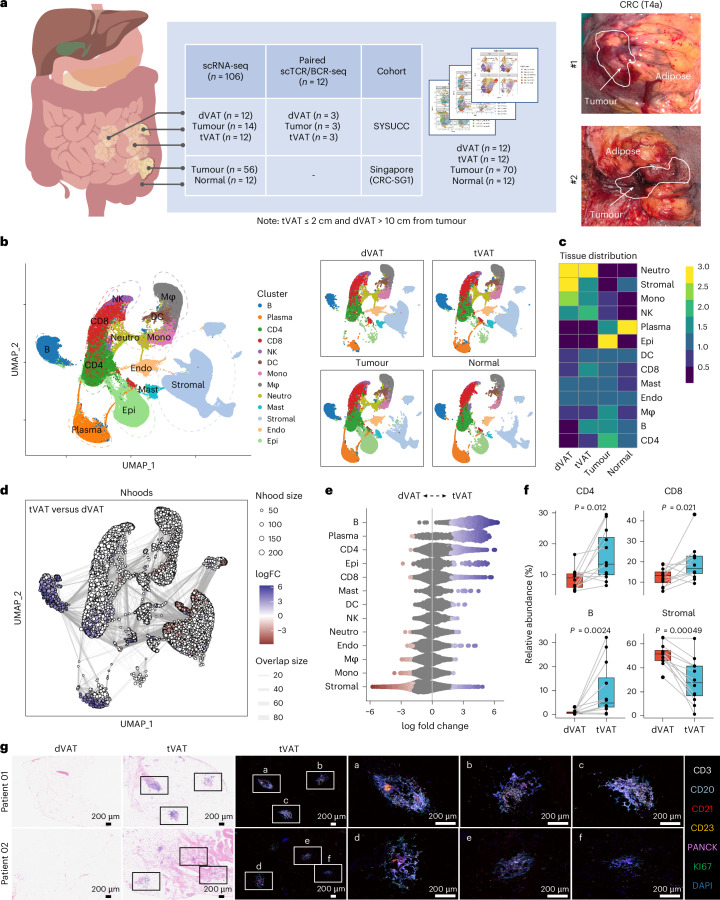
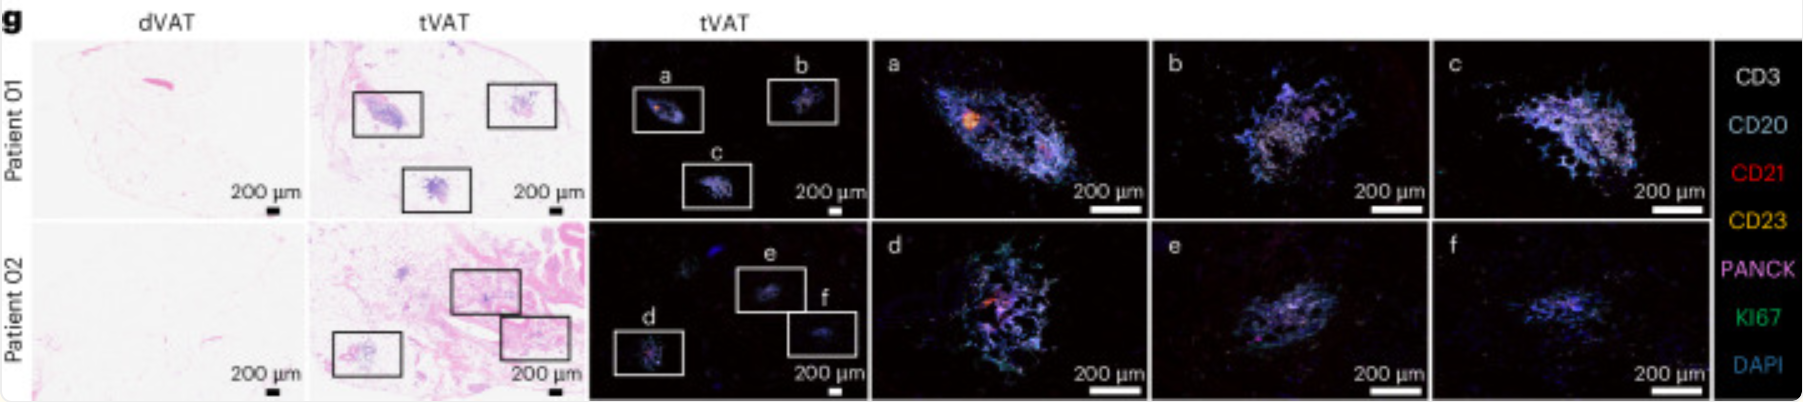
a, Study design illustrating the data analysis (left), and representative images of surgical specimens from patients with CRC (Stage, T4a; right). b, Uniform Manifold Approximation and Projection (UMAP) visualization showing major cell clusters from tumour, normal, tVAT and dVAT samples derived from patients with CRC. The cell types shown NK cells, DC, Mono (monocytes), Mφ (macrophages), Neutro (neutrophils), Mast (mast cells), Endo (endothelial cells) and Epi (epithelial cells). c, Heatmap showing the tissue preferences of 13 cell types by the Ratio of observed to expected (Ro/e) index, illustrating preferential cell type enrichment across different tissue regions. d, UMAP visualization of neighbourhoods (Nhoods) identified by Milo, highlighting the differentially abundant neighbourhoods between tVAT and dVAT. Each Nhood is represented as a node, coloured according to log2 fold change (FC) between tVAT (n = 12) and dVAT (n = 12). Non-differentially abundant neighbourhoods (false discovery rate ≥ 0.1) are displayed in white. Node sizes are proportional to the number of cells in each Nhood, with graph edges representing shared cell quantities between adjacent neighbourhoods. e, Beeswarm plot illustrating the distribution of adjusted log2 FC in abundance of Nhoods between tVAT (n = 12) and dVAT (n = 12) across all cell types. The cell types shown include major immune cell and stromal cell lineages. f, Boxplot comparing the relative abundance of CD4+ T cells, CD8+ T cells, B cells and stromal cells between tVAT (n = 12) and dVAT (n = 12), analysed using a two-sided paired Wilcoxon test. The box hinges denote the first and third quartiles, the median is represented by the centre line and the whiskers encompass the full data range. Individual data points are shown as dots. g, Representative images of hematoxylin and eosin staining (23 samples) and mIHC staining (four samples) for TLSs in dVAT and tVAT sections from patients with CRC. Scale bar, 200 μm. Panel a created in BioRender: Huaiqiang, J. https://biorender.com/vnv4y0b (2026).
图Extended Data Fig. 1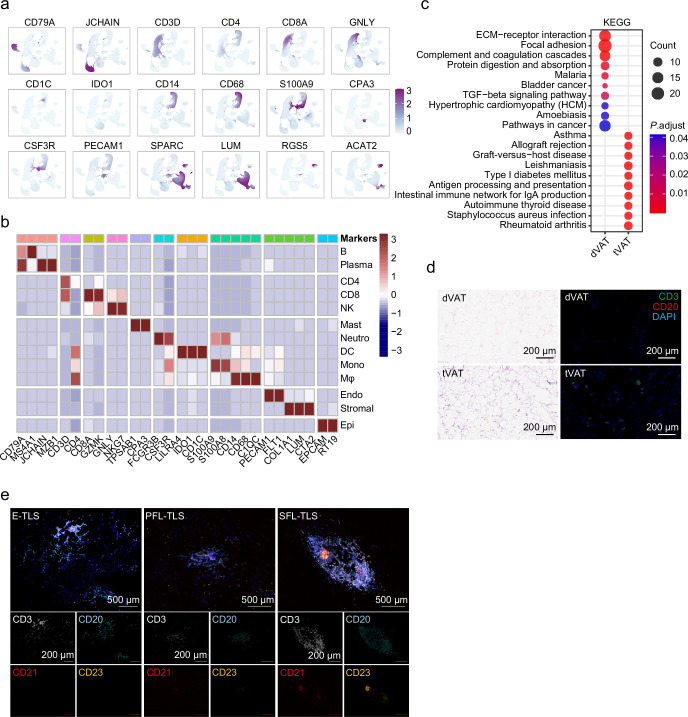
2. tVAT 通过 CXCL12-CXCR4 轴 "截留" 免疫细胞
剔除 tVAT 后,肿瘤生长大幅受抑,肿瘤内 CD4⁺、CD8⁺ T 细胞浸润明显增多(原文 Fig. 3b-e)。机制明确:tVAT 中的脂肪来源癌相关成纤维细胞(adCAFs)高分泌 CXCL12,通过信号轴竞争性抢夺免疫细胞,阻断其向肿瘤浸润(原文 Fig. 4a-b)。
Fig. 3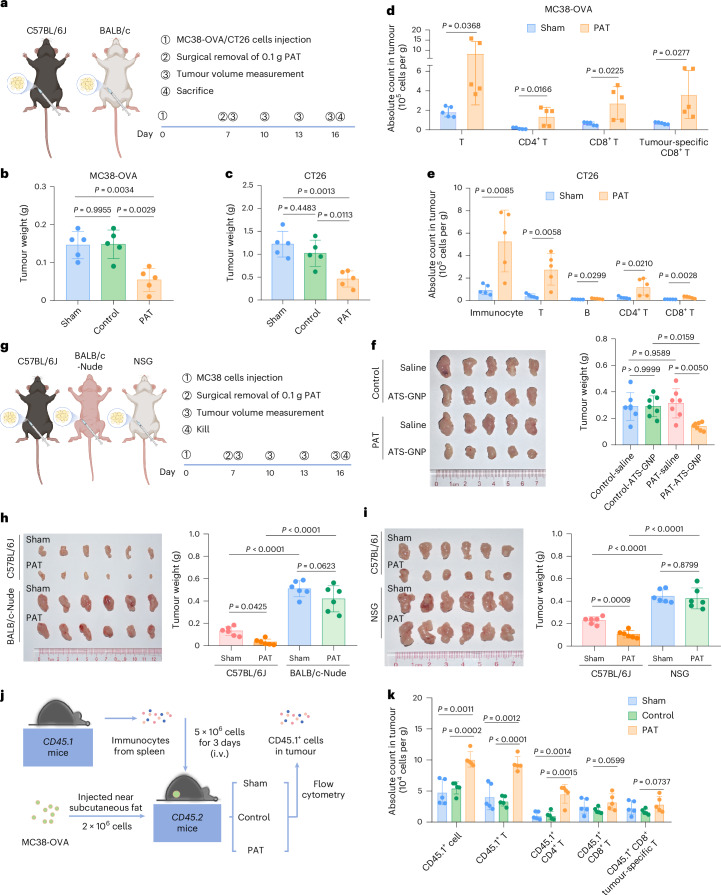
a, Experimental design of the PAT immune-competition model using C57BL/6J or BALB/c mice with the removal of either PAT or contralateral inguinal adipose tissue (control). b,c, Tumour weights of MC38-OVA (b) or CT26 (c) tumours at day 16 of the experiment in C57BL/6J or BALB/c mice (n = 5). d,e, Flow cytometry analysis of the infiltration of T cells, CD4+ T cells, CD8+ T cells, and tumour-specific CD8+ T cells in MC38-OVA (d) or CT26 (e) tumours, with and without removal of PAT (n = 5). To identify OVA-specific CD8+ T cells, H-2Kb tetramers were employed in the MC38-OVA tumour model that endogenously expresses ovalbumin. f, Representative images of MC38 tumours (left) and tumour weights (right) in C57BL/6J mice following removal of PAT or control, and treatment with ATS-GNP or saline (n = 5). g, Experimental design of the PAT immune-deficient model (BALB/c-Nude or NSG) with removal of PAT. h,i, Representative images of MC38 tumours (left) and tumour weights (right) at day 16 in C57BL/6 J, BALB/c-Nude (h), or NSG mice (i) (n = 6). j, Schematic representation of the strategy to detect CD45.1+ cells in MC38-OVA tumours, with and without removal of PAT or contralateral inguinal adipose tissue (control), using the CD45.2 receptor mouse model transferred with CD45.1 splenocytes from CD45.1 donor mice. i.v., intravenous. k, Quantitative analysis of various types of CD45.1+ cells in MC38-OVA tumours with and without removal of PAT or control, as determined by flow cytometry (n = 5). Data represent ≥3 independent experiments. Statistical significance was assessed using a two-sided, unpaired Student’s t-test (d,e,k), one-way analysis of variance (ANOVA) with Tukey’s correction for multiple comparisons (b,c,f right), a two-way ANOVA with Tukey’s correction for multiple comparisons (h right) or a two-way ANOVA with Tukey’s correction for multiple comparisons (i right). Graphs display mean ± s.d. (b–f,h i,k). Panels created with BioRender: a, g and j, Huaiqiang, J. https://biorender.com/f9uacgq (2026).
Fig. 4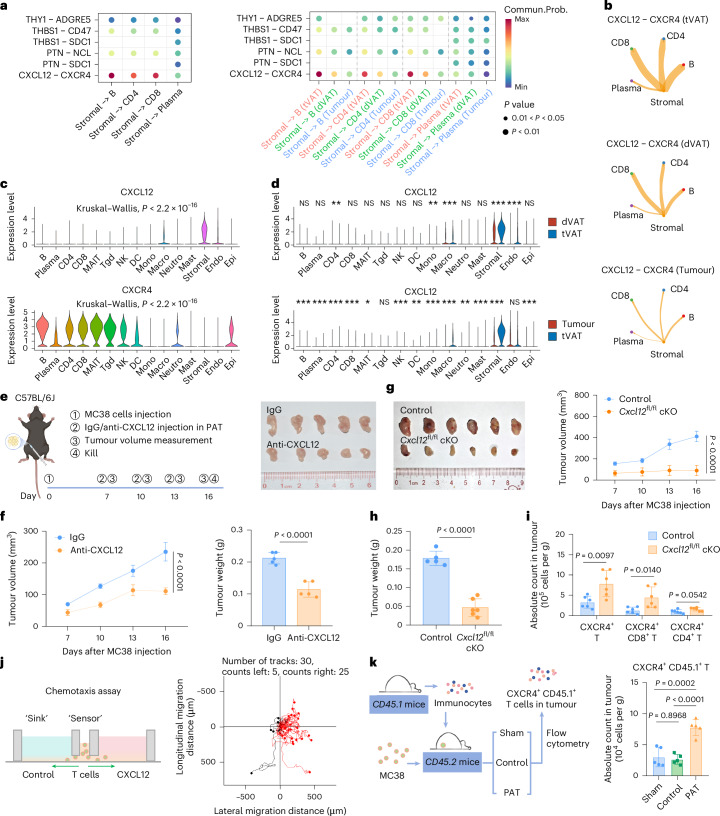 a, Cell–cell communication analysis based on ligand–receptor interactions (top six) between stromal cells and lymphocytes in tVAT (left) and a comparison between tVAT, dVAT and tumour (right). b, Marked CXCL12–CXCR4 interactions among CD8+ T cells, CD4+ T cells, B cells, plasma cells and stromal cell populations in tVAT, dVAT and tumour. The width of the lines represents the probability of communication. c, Violin plots showing the expression of CXCL12 (top) and CXCR4 (bottom) across all cell types in patients with CRC. d, Violin plots comparing the expression of CXCL12 in dVAT versus tVAT (top) and tumour versus tVAT (bottom) in patients with CRC, analysed using a two-sided Wilcoxon test. e, Experimental design for the PAT C57BL/6J mouse model treated with IgG or anti-CXCL12 antibody (left), and representative MC38 tumour images at day 16 of the experiment (right) (n = 5). f, Tumour growth (left) and tumour weights (right) of MC38 tumours at day 16 of the experiment in C57BL/6J mice (n = 5). g, Representative MC38 tumour images (left) and tumour growth (right) of experiments in control and Cxcl12fl/fl cKO mice (n = 6). h, Tumour weights of MC38 tumours in control and Cxcl12fl/fl cKO mice at day 16 of the experiment (n = 6). i, Flow cytometry analysis of the infiltration of various CXCR4+ immune cells in MC38 tumours in Control and Cxcl12fl/fl cKO mice (n = 6). j, Schematic diagram of the chemotaxis assay using T cells as ‘sensors’ and conditional medium as a ‘sink’ (left), and the aggregated trajectories of control or CXCL12-induced T cells migrating for 1 h (right). k, Quantitative analysis of CXCR4+ CD45.1+ T cells in MC38 tumours with and without removal of PAT or contralateral inguinal adipose tissue (control) by flow cytometry (n = 5). Data represent ≥3 independent experiments. Statistical significance was assessed by a two-sided permutation test (a), two-sided unpaired Student’s t-test (f right, h and i), one-way analysis of variance (ANOVA) with Tukey’s correction for multiple comparisons (k right) or two-way ANOVA (f left and g right). Graphs display mean ± s.d. (f–i,k). Panels created with BioRender: e and k, Huaiqiang, J. https://biorender.com/ovq2e39 (2026).
3. 肿瘤诱导脂肪间充质转化生成 adCAFs
肿瘤分泌 TGF-β1,诱导脂肪基质细胞定向转化为 adCAFs,伴随 CAFs 关键标志物显著上调(原文 Fig. 6h-i、Extended Data Fig. 7f-g),成为免疫逃逸的核心驱动细胞。
Fig. 6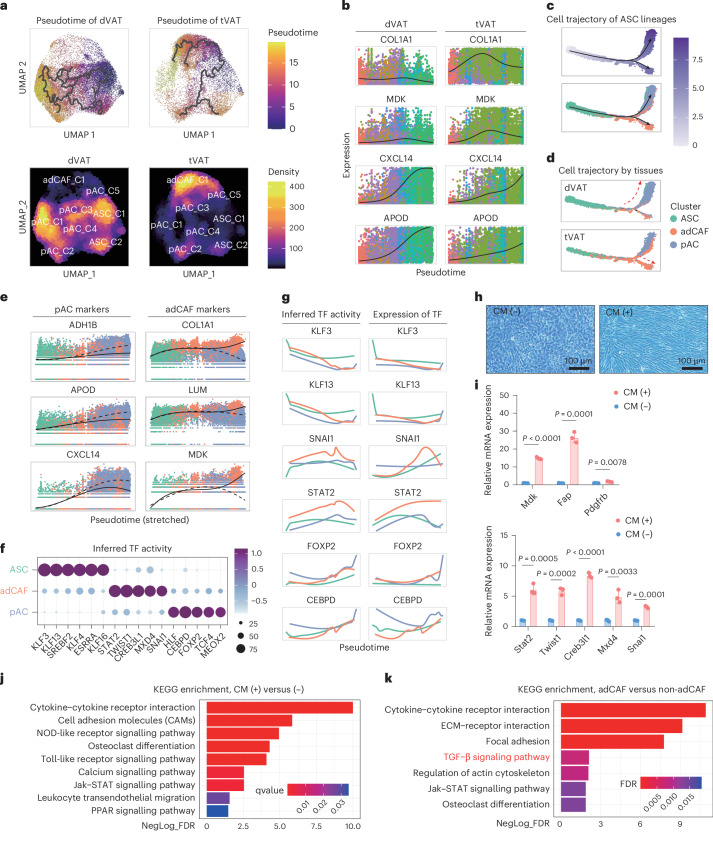
a, Cell trajectories (top) and cell abundance (bottom) of ASC-derived pAC and ASC-derived adCAFs inferred by Monocle3, with cell trajectories in dVAT (left) and tVAT (right). The pseudotime colour code is shown in the right box. b, Dynamic changes in the expression of several marker genes over time in dVAT (left) and tVAT (right) by monocle3 pseudotime. c, Pseudotime (top) and cell trajectories (bottom) of ASC-derived pAC and ASC-derived adCAFs inferred by Monocle2. The pseudotime colour code is shown in the right box. d, Cell trajectories in dVAT (top) and tVAT (bottom) of ASC-derived pAC and ASC-derived adCAFs inferred by Monocle2. e, Dynamic changes in the expression of several marker genes over time in pAC markers (left) and adCAF markers (right) by monocle2 pseudotime. f, Dot plot showing the inferred differential transcription factor (TF) activities in ASC, pAC and adCAF. g, Dynamic changes in inferred activities and RNA expression levels of TFs in ASC, pAC, and adCAF. h, Representative images of the morphology of mASCs treated with MC38 tumour-derived CM from MC38-derived tumour tissues for 72 h. Scale bar, 100 μm. i, RT–qPCR detecting the RNA expression of adCAF-associated genes (top) and TFs (bottom) in mASCs treated with CM. j, Bar chart of KEGG pathway enrichment analysis showing differentially enriched signalling pathways in mASCs treated with tumour CM. (k) Bar chart of KEGG pathway enrichment analysis showing differentially enriched signalling pathways between adCAF-enriched stromal cells and non-adCAF stromal cells. Data represent ≥3 independent experiments. All data are shown as mean ± s.d. and statistical significance was assessed by a two-sided, unpaired Student’s t-test (i).
Extended Data Fig. 7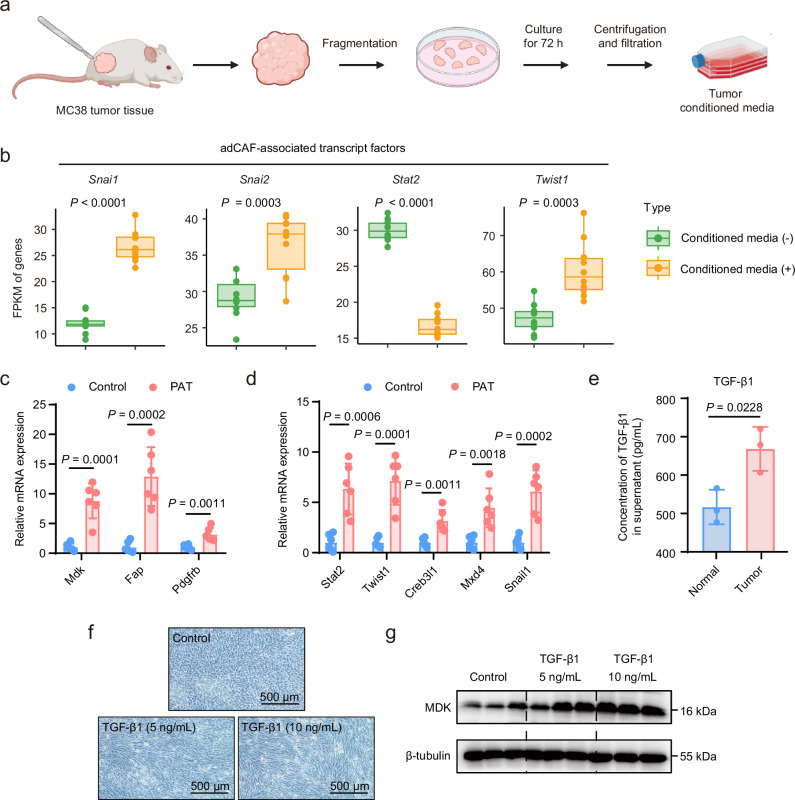
a.Experimental flow chart for dissecting MC38 tumours from tumour-bearing mice and preparing tumour conditioned media. b. RNA sequencing detecting the RNA expression of 4 adCAF-associated transcript factors in mAPCs treated with tumour conditioned media (n = 10). The data are presented as a box-and-whisker graph (bounds of box: first to third quartile, bottom and top line: minimum to maximum, central line: median). Statistical significance was assessed using a two-sided, unpaired Student’s t-test. c. RT-qPCR detecting the RNA expression of adCAF-associated genes in peritumoral adipose tissue (PAT) and contralateral adipose tissue (Control) from MC38 tumour-bearing mice (n = 6). Statistical significance was assessed by a two-sided, unpaired Student’s t-test. d. RT-qPCR detecting the RNA expression of adCAF-associated TFs in PAT and contralateral adipose tissue from MC38 tumour-bearing mice (n = 6). Statistical significance was assessed by a two-sided, unpaired Student’s t-test. e. ELISA detecting the concentration of TGF-β1 in the supernatant of MC38-derived tumours (n = 3) or normal intestinal tissue (n = 3). Statistical significance was assessed using a two-sided, unpaired Student’s t-test. f. Representative images of the morphology of mouse adipose progenitor cells (mAPCs) treated with mouse TGF-β1 protein. g. Western blot analysis detecting the expression of adCAF marker genes (MDK) in mAPCs treated with mouse TGF-β1 protein at concentrations of 5 or 10 ng/mL. Panel created with BioRender: a, Huaiqiang, J. https://biorender.com/y65a209 (2026).
4. 靶向 tVAT 大幅提升免疫治疗疗效
临床数据证实:tVAT 面积可精准预判免疫治疗应答(AUC=0.887),高 tVAT 患者应答率仅 17.1%(原文 Fig. 7i-j);靶向阻断 CXCL12-CXCR4 轴,可强效增强抗 PD-1 治疗效果(原文 Fig. 7a-f)。
Fig. 7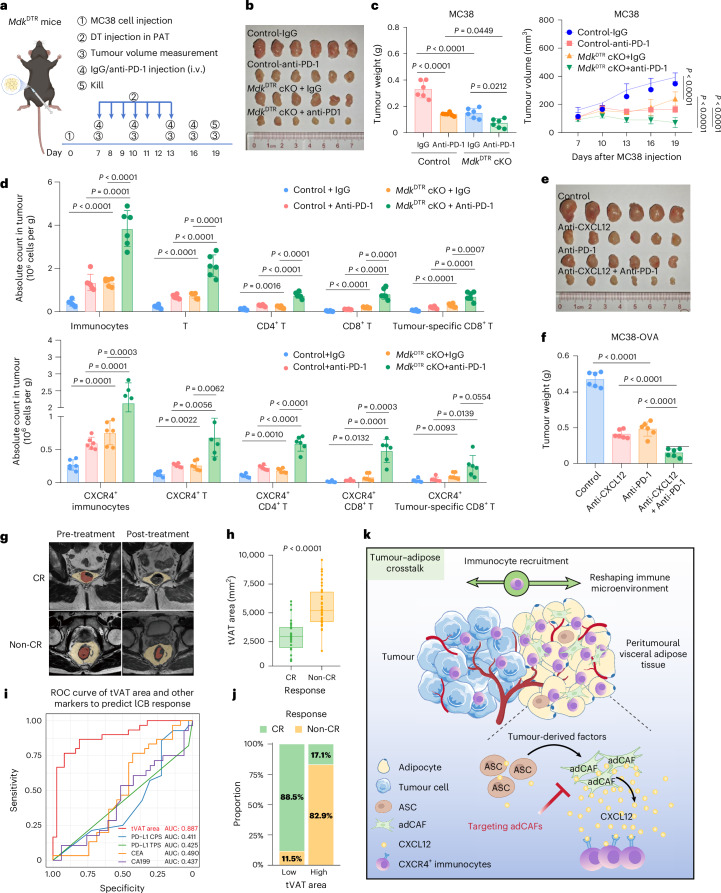 a, Experimental design for constructing Control and MdkDTR cKO mice bearing MC38 tumours near PAT, followed by αPD-1 therapy. b,c, Representative MC38 tumour images (b), tumour weights (c left) and tumour growth (c right) in control and MdkDTR cKO mice treated with IgG or anti-PD-1 (n = 6). d, Flow cytometry analysis of the infiltration of immunocytes, including T cells, CD4+ T cells, CD8+ T cells, and tumour-specific CD8+ T cells, CXCR4+ immunocytes, CXCR4+ T cell, CXCR4+ CD4+ T cell, CXCR4+ CD8+ T cell and CXCR4+ tumour-specific T cell in MC38-OVA tumours from the four treatment groups (n = 6). e,f, Representative MC38 tumour images (e) and tumour weights (f) of the experiment in mice treated with anti-CXCL12 and/or anti-PD-1 (n = 5). g, Representative MRI image of CRC tumour and corresponding tVAT area region of CR and non-CR patients pre- and post-immuno-chemoradiotherapy. The yellow area represents the tVAT area, whereas the red area denotes the tumour region. Note that the mass visible in the intestinal lumen (top right) is faecal material. h, Pre-treatment tVAT area difference based on 3D Slicer between CR (n = 30) and non-CR (n = 37) patients. The data are presented as a box-and-whisker graph (bounds of box show first to third quartile, bottom and top line show minimum to maximum and the central line shows the median). i, ROC plot of response predicting ability of pre-treatment PAT area in immuno-chemoradiotherapy of proficient mismatch repair patients with CRC, compared with conventional indexes, including CPS, TPS, CEA and CA199 (n = 67) with optimal cutoff. j, Comparison of pCR ratio in tVAT high and low group according to the optimal cutoff. k, Graphical abstract depicting how tumours reshape the stromal environment in tVAT and how tVAT competes for immunocytes from the tumour to promote immune escape. Data represent ≥3 independent experiments. Statistical significance was assessed using a two-sided, unpaired Student’s t-test (d,h), one-way ANOVA with Tukey’s correction for multiple comparisons (c left, f) or two-way ANOVA with Tukey’s correction for multiple comparisons (c right). Graphs display mean ± s.d. (c,d,f,h). Panels created with External, opens in a new tab.BioRender: a and k, Huaiqiang, J. External, opens in a new tab.https://biorender.com/e5jwcye (2026).
三、abs933 深度赋能实验|应用场景 + 专属产品优势
1、文中实际应用位点(有据可依)
研究团队在以下关键切片染色实验中全程使用 abs933 封闭:
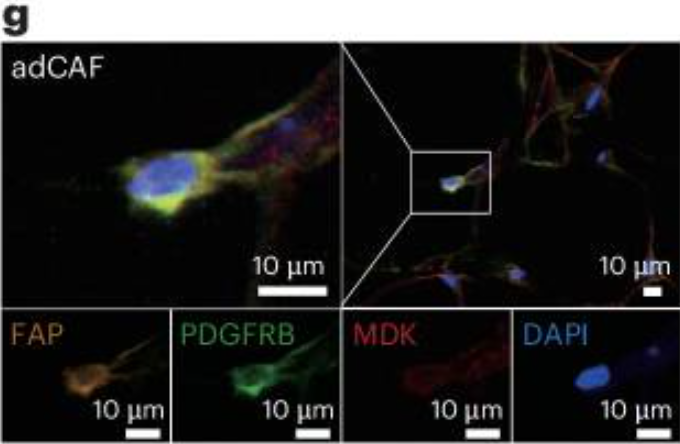
- ✅ 多重免疫组化 mIHC 验证 tVAT 内 adCAFs 空间分布(原文 Fig. 5g)
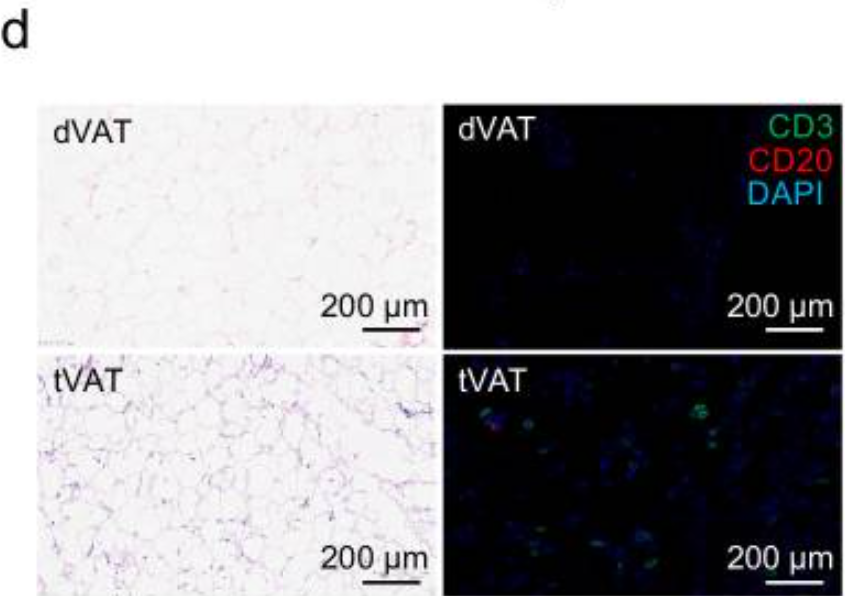
- ✅ 免疫荧光 IF 检测淋巴细胞浸润差异(Extended Data Fig. 1d)
- ✅ TLSs 三级淋巴结构细胞组成特异性染色(原文 Fig. 1g)
2、爱必信 abs933 核心产品优势(科研刚需亮点)
① 超低非特异性背景,染色信噪比拉满
严格过滤杂蛋白与异源抗体干扰,完美适配脂肪组织、肿瘤致密组织等难染色样本,彻底规避背景斑驳、荧光弥散问题,保证 adCAFs、T 细胞定位成像清晰可读,贴合高分刊图片质控标准。
② 抗原保护性配方,不破坏样本天然表位
温和无菌高纯工艺制备,规避强酸强碱改性,封闭过程不损伤脂肪间质、膜蛋白抗原位点,保障一抗特异性结合效率,杜绝假阴性、信号偏弱误差。
③ 适配多色多重染色,杜绝交叉反应
专为 mIHC、多标免疫荧光体系优化,山羊血清基质兼容性极强,搭配兔抗、鼠抗等主流一抗 / 二抗组合无排异,多指标共定位实验结果稳定可重复。
④ 无菌质控 + 批次均一,长期实验零波动
全程无菌灌装、内毒素严控,批次间蛋白浓度、活性高度统一,动物组织实验、长期梯度验证实验,无需频繁摸条件、换试剂,大幅降低实验返工率。
⑤ 即用型成品,省心高效适配高通量实验
无需自行稀释、灭活、配比,开瓶直接用于切片封闭,适配课题组高通量批量染色,节省前期试剂配制时间,加速机制验证进度。
正是依托 abs933 以上硬核优势,研究团队才能精准呈现细胞空间分布、清晰区分阳性信号,让核心免疫截留机制的形态学证据扎实可信,助力成果顺利登顶高分文献。
四、临床转化前景 + 品牌赋能价值
该研究打通了「脂肪微环境 - 免疫逃逸 - 免疫治疗」全新通路,tVAT 靶向干预、影像学预判标志物的落地,将为结直肠癌患者个体化治疗提供全新方向。
爱必信 abs933 作为肿瘤免疫、组织病理、荧光成像领域爆款封闭试剂,已累计助力数千篇高分 SCI 发文,广泛应用于脂肪代谢、肿瘤微环境、炎症免疫、干细胞染色等各类科研场景。我们坚持严控原料与质控,用高稳定性、高兼容性试剂,为每一项前沿科研研究保驾护航。

Absin产品线:
爆款产品:十大试剂盒(mIHC、IHC、凋亡、ELISA、ChIP、Co-IP、生化检测、残留检测、多因子检测);细胞培养(类器官试剂盒+基质胶,胎牛血清+培养添加剂+细胞因子)、分化试剂盒;分子(mRNA合成服务+提取试剂盒);化合物大包装;辅助试剂、耗材/仪器、定制服务(抗体/多肽/蛋白/标记/检测)...
特色产品:鸡胚提取物CEE、B27、N2、霍乱毒素B亚单位CTB、牛脑垂体提取物BPE、百日咳毒素PTX、重组人胰岛素Insulin、人源低密度脂蛋白LDL...
|
爱必信(上海)生物科技有限公司 联系邮箱:info@absin.cn 微信公众号:爱必信生物 |
.jpg) |














 危险品化学品经营许可证(不带存储) 许可证编号:沪(浦)应急管危经许[2022]202585(YS)
  营业执照(三证合一)